Ziyan Liao
You can use the editor on GitHub to maintain and preview the content for your website in Markdown files.
About me
Name: Ziyan Liao
Date of birth: 10/02/1999
Nationality: China

Education background
-
MPhil in Electrical Engineering, 2020.11-2021.11
University of Manchester, UK
Supervisor: Dr Alessandra Parisio
-
Exchange student in Electrical Engineering, 2019.07-2020.07
University of Birmingham, UK
Supervisor: Dr Dilan Jayaweera
GPA: 3.5/4.0, Weighted Average Mark:65.667/100
-
B.E. in Electrical Engineering, 2016.09-2019.06
Beijing jiaotong University (BJTU), China
Supervisor: Prof Xiaojun Wang
GPA: 3.37/4.0, Weighted Average Mark:83.5/100
Research experience
1. Reliability assessment and optimization of multi-energy system, 2020.11-2021.11
This is the main project that I have investigated in my research during my MPhil study in University of Manchester this year. This project mainly includes five parts:
(1) Modeling of multi-energy system;
(2) Reliability assessment in multi-energy system considering load uncertainties;
(3) Reliability optimization of multi-energy system considering energy storage devices effects;
(4) Sensitive analysis of proposed research;
(5) Optimal dispathing problem in multi-energy system.
At present, all the main parts of this project have been finished, and my first paper is going to be published. I still make an effort to get another chance to have my second publication.
(1) Modeling of multi-energy system
The multi-energy system contains IEEE 24 bus system, 13-node heat network, and 9-node natural gas system. The multi-energy schematic diagram is shown as below:

(2) Reliability assessment in multi-energy system considering load uncertainties
The Weibull distribution and Beta distribution have been used to model wind and PV uncertainties.

The power load curve of MES after considering uncertainties is shown below:

BP neural network also has been adopted to forecast different types of load, the load forecasting results for heat and natural gas network user is presented below:

The implementation of sequential Monte Carlo simulation in multi-energy system reliability evaluation with different energy storage devices considering time varying cost models and load uncertainties can be presented in the following flow chart:

(3) Reliability optimization of multi-energy system considering energy storage devices effects
Determine the optimal location number of storage device in power grid, heat network and gas network at the lowest possible cost and highest reliability under load uncertainty are the main objective of the research. The reliability optimization problem has been formulated as a multi-objective optimization problem (using NSGA-II algorithm) to minimize reliability index SAIDI (system average interruption duration index) and reliability cost. The cost functions are modeled as the interruption cost of different types of customer and installation cost of energy storage devices. A comparative analysis with other modern multi-objective algorithms such as MOPSO and SPEA2 is presented to validate the effectiveness of the proposed approach.
The Pareto Front results of the multi-objective optimization is presented as below:

(4) Sensitive analysis of proposed research
Reliability sensitivity analysis is to obtain the partial differential of each reliability index against component parameters. The sensitivity index reflects the change degree and trend of system reliability caused by the small change of component parameters. this paper analyzes the influence of line failure rate and repair time, transformer failure rate and repair time, coupling components such as CHP, P2G, GB failure rate and repair time on the important system reliability index. Taking the 2 MESs as an example, the sensitivity of each index after the reliability parameter of each component is reduced by 10% is calculated respectively. The results of reliability sensitivity analysis are shown in the following figures:

(5) Optimal dispathing problem in multi-energy system
When we consider the minimum cost as the obective function, using YALMIP+CPEX solver, we can get the optimal dispatching of each unit shown as the following figures:


2. Multi-energy system resilience to extreme weather, 2020.11-2021.11
The main controbution of this project includes:
(1)Resilient modeling of multi-energy system under extreme weather will be presented, which includes line fragile modeling, substation fragile modeling, and components availability modeling;
(2)Sequential Monte Carlo simulation is used to assess multi-energy system resilience under the impact of time-varing and space-varying of extreme weather using the fragile models and multi-temporal AC optimal power flow;
(3)A specifically introduced mix of operational and infrastructure reliability indices LOLF (Loss of Load Frequency, occs/year) and EENS (Expected Energy Not Supplied, MWh/year) are used to reflect the resilience degradation due to the extreme event for increasing intensities (i.e., increasing maximum wind speeds);
(4)The impact evaluation of different resilience enhancement strategies which includes redundancy, robustness, responsiveness are considered to compare the effectiveness of the resilient measures.
The results of resilience modeling of MES:

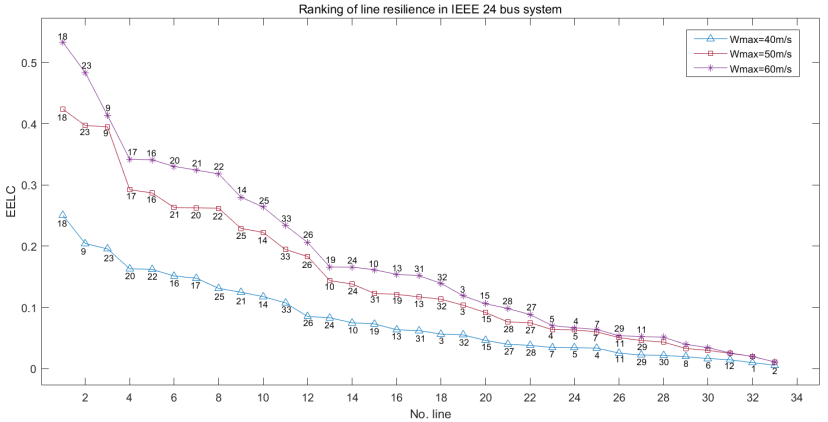
The ranking results of EELC, EHLC, and EGLC are presented in the following three figures. The vertical axis represents the load curtailments indices (i.e., the percentage of load curtailments (EENS) over the whole simulation times), while the horizontal axis shows the lines ranking (i.e., 1 to 33, the number of lines of the power system) based on their load curtailments indices.


The resilience enhancement case studies include “redundancy”, “robustness” and “responsiveness” adaptation options. These case studies are applied on the transmission lines according to their contribution to system resilience, as this is determined based on their load curtailments indices ranking results. In particular, a parallel, identical transmission line is added for the “redundant case”, the resistance to high wind speeds of the transmission line is increased for the “robustness” case, and the time to repair of a transmission corridor is considered unaffected and equal to for the “responsiveness” case.


The resilience enhancement case studies include “redundancy”, “robustness” and “responsiveness” adaptation options. These case studies are applied on the transmission lines according to their contribution to system resilience, as this is determined based on their load curtailments indices ranking results. In particular, a parallel, identical transmission line is added for the “redundant case”, the resistance to high wind speeds of the transmission line is increased for the “robustness” case, and the time to repair of a transmission corridor is considered unaffected and equal to for the “responsiveness” case. However, instead of applying these resilience enhancement strategies to a single, individual line, all the transmission lines are divided in resilience enhancement groups based on their load curtailments indices ranking results, with each group including 6 lines (3 lines in power system, 2 lines in heat network, and 1 line in natural gas network). For example, the first group will include the first 6 most critical circuits of each wind level (i.e., line 18, 9, 23 in power system, line 8, 3 in heat network, and line 5 in natural gas system when = 40 m/s), the second group will include the first 12 critical circuits. Figures show the percentage increase in the resilience by applying the resilience adaptation measures, as expressed using the decrease in EENS (similar results are obtained for LOLF). The horizontal axis of above figures shows the number of lines (or the number of resilience enhancement groups, e.g., 6 lines = group 1, 12 lines = group 2, and so on) for which the case studies are applied. There is a big increase in resilience (i.e., drop in EENS) for the case studies when the first 6 critical lines are enhanced, e.g., close to 33% for the robust case for Wmax = 40 m/s. Resilience is further increased when the resilience of additional individual lines is improved, but this becomes smoother, which is expected because as their EELC, EHLC, and EGLC indices decrease, their contribution to the overall test network resilience decreases. Moreover, with the increase in wind speed, the advantage of robust strategy diminishes, as the data shows the resilient enhancement has declined from 33% in Wmax = 40 m/s to 7% in Wmax = 60 m/s on an average, while the redundancy case shows better performance than responsive case but the all render an uptrend. Comparing the effectiveness of the resilient measures, it can also been seen that among the three strategies, the third one robust strategy can maximum improve multi-energy system resilience when the maximum wind speed smaller than 50 m/s, whereas the redundant case has a higher impact than the responsive, and they have a better performance when maximum wind speed is 60 m/s, than the robust case. Further, it is highlighted that the prioritization of resilience enhancement interventions might change for different wind speeds [1].
3. Reliability assessment in a smart power system with smart reconfiguration of lines, 2019.09-2020.06
This is the project when I was an exchange student in University of Birmingham last year. Using DIGSILENT power factory to model smart power system based on IEEE 24 bus system. The aim of this project is to model reconfiguration of lines in a smart grid and then assessing the performance with the introduced new environment. The project involves modelling of smart reconfiguration of lines by applying smart switching and network congestion issues.
The following figures are the IEEE 24 bus system and RBTS bus 5 system that I built in Digsilent software.


Different reconfiguration scheme are used to compare the reliability performance. Among the 4 cases, case 4 is the optimal one, which obtained from simulated annealing algorithm.
 After applying the optimal reconfiguration scheme to the power distribution system RBTS bus 5, the system diagram is shown below:
 Load points 12 and 13 have transferred to feeder 1, and load points 25 and 26 have transferred to feeder 3.
4. Geometric parameter imaging monitoring of railway contact wire (overhead line) based on laser radar, 2018.06-2019.04
This is the project when I was a sophomore in Beijing jiaotong University beween 2018-2019. This project used MATLAB to process the data collected from the laser radar to reconstruct the image and calculate the guide height, pull out value and accuracy of the laser radar. The following video is I obtained from laser radar.

Due to the limitation of the test condition, we have used a stick to simulate the railway contact wire. The length of the stick is the height of conductor, and the distance between stick and laser radar is the stagger value. The right side video is an actual experimental situation. The left side is what we got from MATLAB, and at the bottom right corner, this programme will indicate the data of the height of conductor and stagger value automatically with the movement of my classmate. Here, I need to point out that, in the real situation, the laser radar needs to be installed on the train, and with the movement of train, it can automatically show different overhead lines’ stagger value and its height. However, due to the limitations of the experimental place, we cannot let the laser radar move as it needs electricity to activate. Inversely, we let the person move to simulate the dynamic situation.

Contact
Phone: +44-7579861784
Email: ziyan.liao@postgrad.manchester.ac.uk